
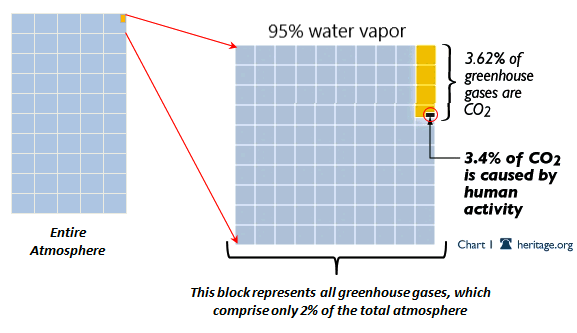
Total amount of “greenhouse” gases in the atmosphere: 2%
Water vapor: 95% of the total amount of “greenhouse” gases
Water vapor is considered a more powerful “greenhouse” gas compared to carbon dioxide
1930 levels of CO2: 300ppm or 3% of the total amount of “greenhouse” gases or 0.03% of the total atmosphere
Current level of CO2: 400ppm or 4% of the total amount of “greenhouse” gases or 0.04% of the total atmosphere
Man’s release of CO2: 3-4% of the 0.04% which is 0.0016%
The highest quality of temperature data are from the US
It was warmer in the US during the 1930’s compared to now despite lower levels of carbon dioxide compared to now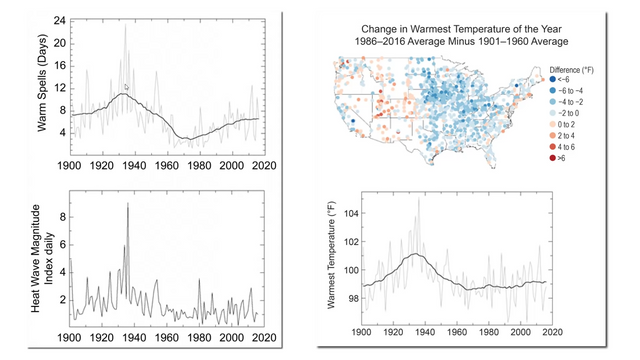
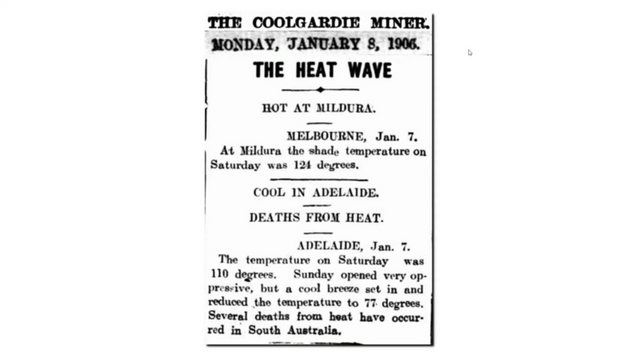
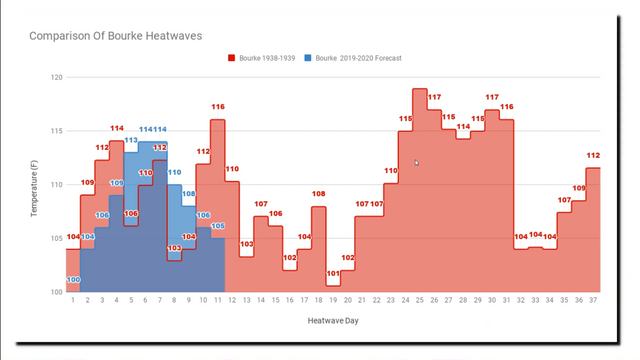
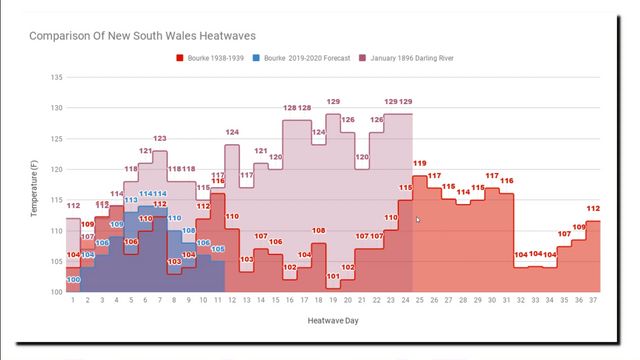
It was warmer during the late 1800’s, 1900’s and during the 1930’s in Australia compared to now despite lower levels of carbon dioxide compared to now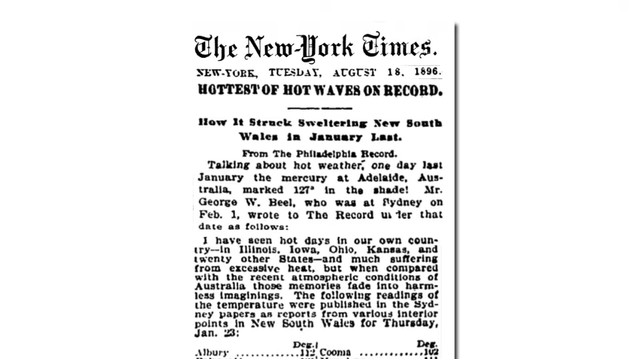
Global warming paused between 1997 and 2015 even when CO2 was increasing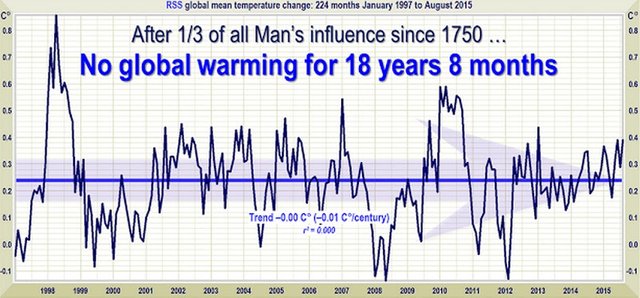
No particular change in temperature between 1895-1987 in the US even when CO2 levels was increasing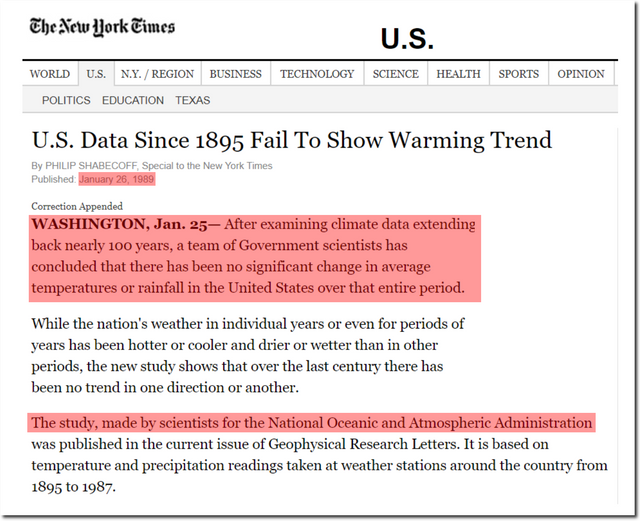
Plants thrive at 1000-1500ppm which is why many greenhouses are using CO2 generators
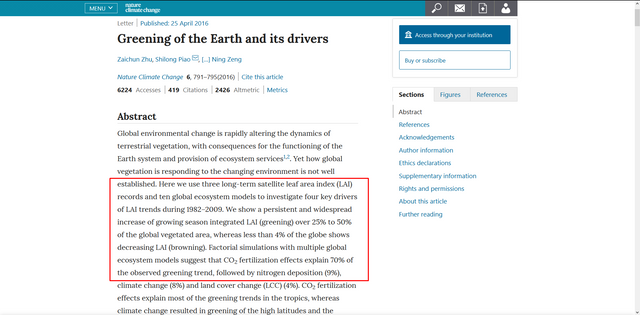
An 11 percent increase in foliage in arid areas between 1982-2010 due to an increase of CO2
An increase of growing season between 1982–2009 over 25-50% of the global vegetated area
Carbon dioxide fertilization explains 70 percent of the greening effect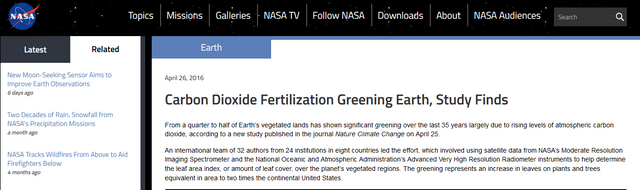
Historical low of CO2: The past 1000 years between 285-400ppm of CO2
Historical high of CO2: 540 million years ago at 7000ppm of CO2
Explosion of life: 540 million years ago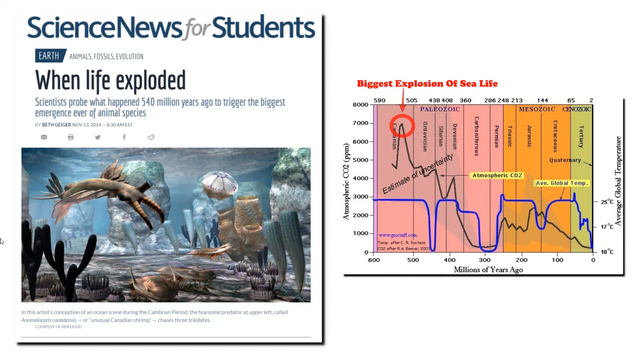
Was warmer during the medieval warm period compared to now
Was lower amount of CO2 in the medieval warm period compared to now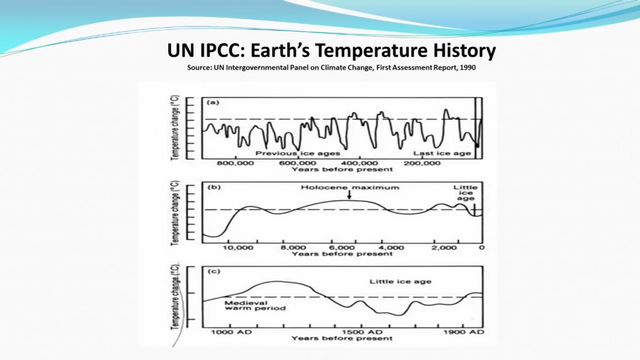
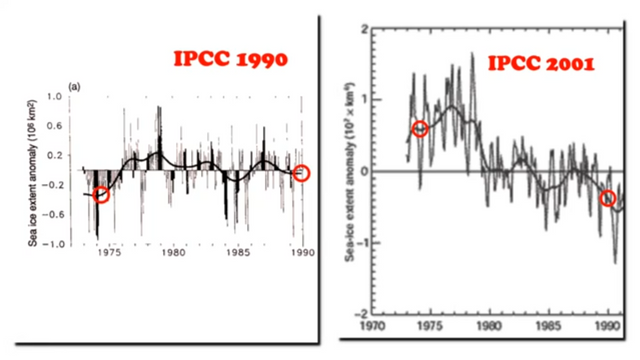
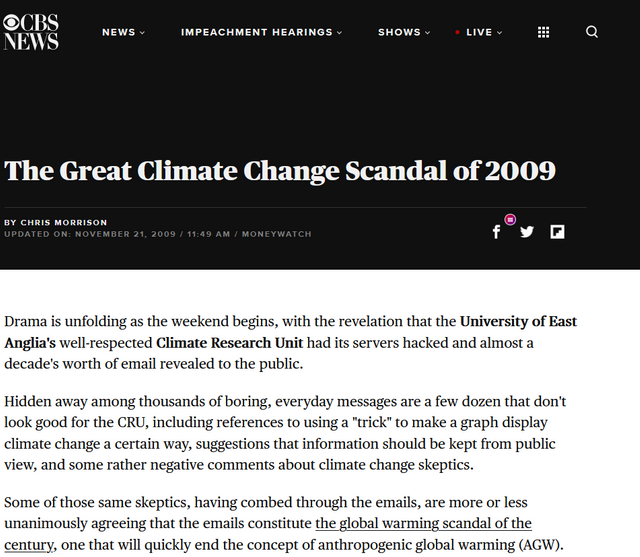
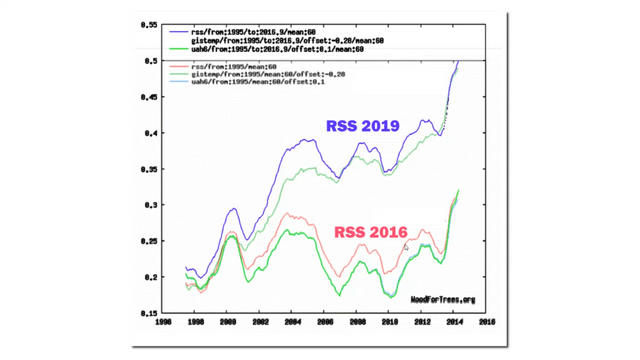
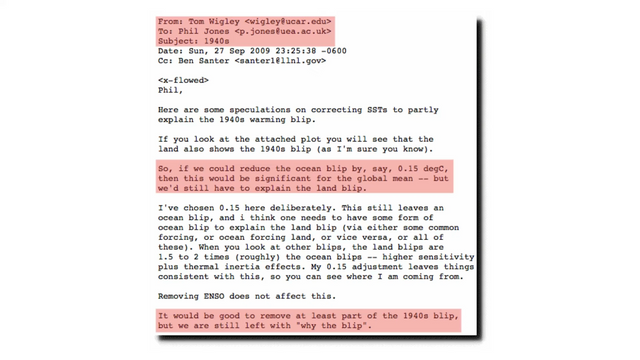
Corruption of previously observed data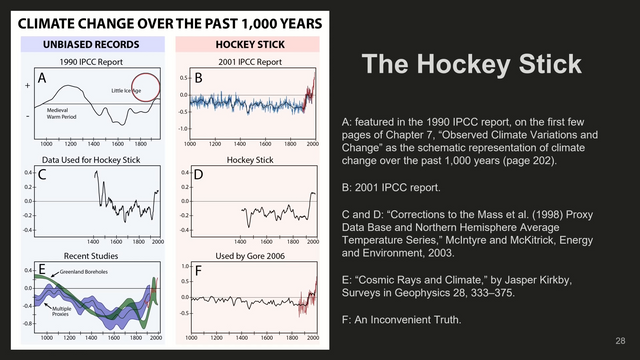

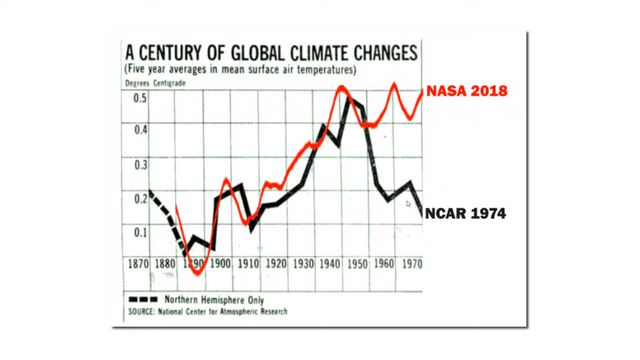
Was cooling between 1940’s and the 1970’s even when CO2 levels was increasing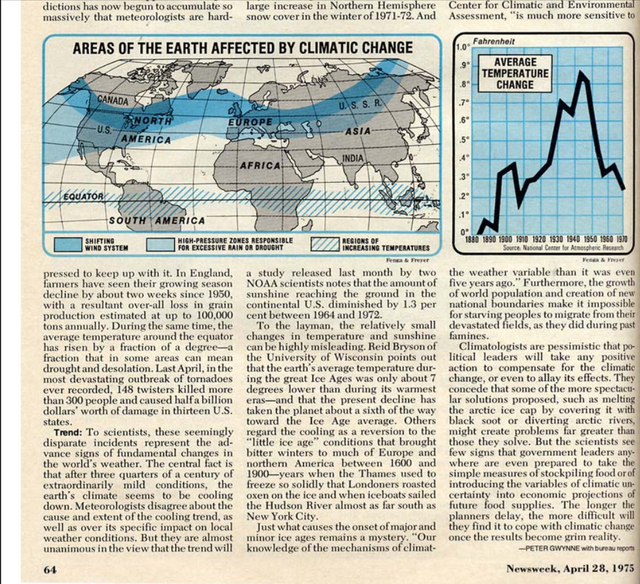
No acceleration in sea level rise since the 1850.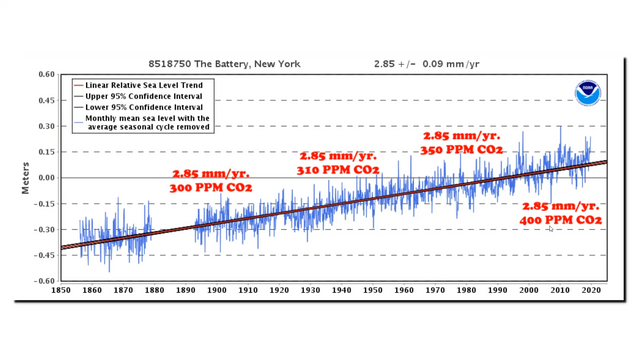
Failed and incomplete climate models that can’t make accurate predicitions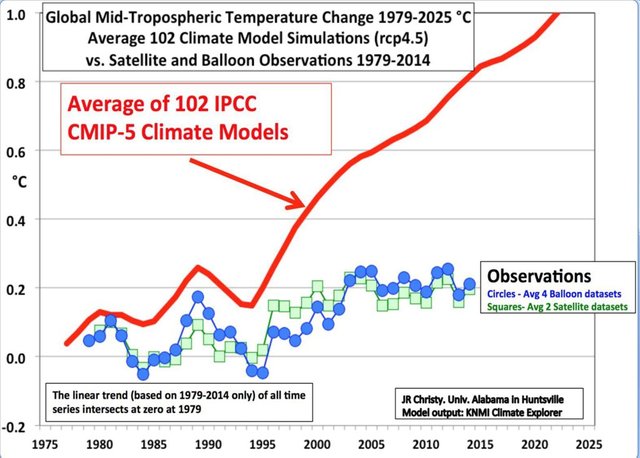
Forest fires in the US has decreased the past 100 years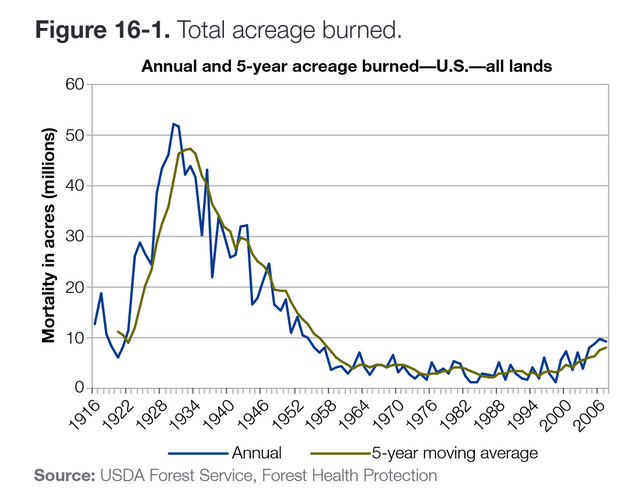
The number of hurricanes in US has declined since the 1850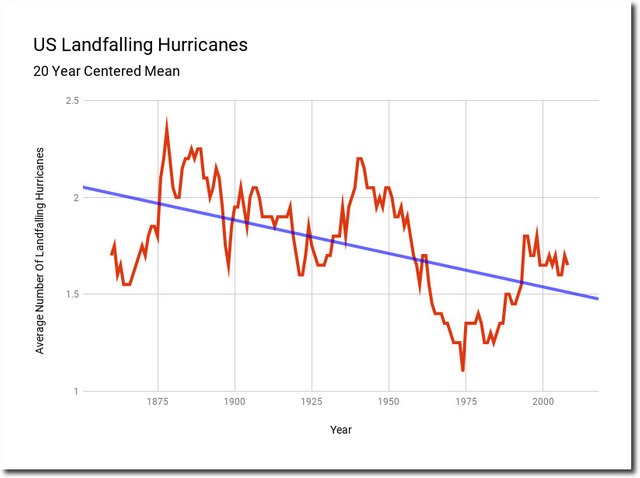
Ocean alkalinity fluctuate but it always remain alkaline regardless of levels of CO2 because of the presence of basalt. As pointed out earlier, the biggest explosion of life happened 540 million years ago and that was when CO2 levels was almost 20x higher than today.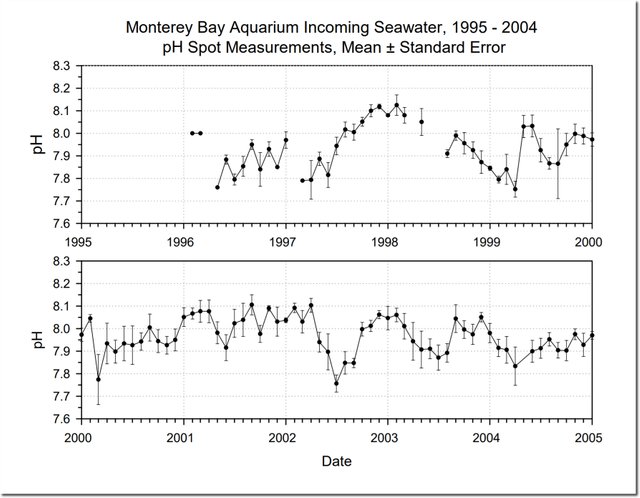
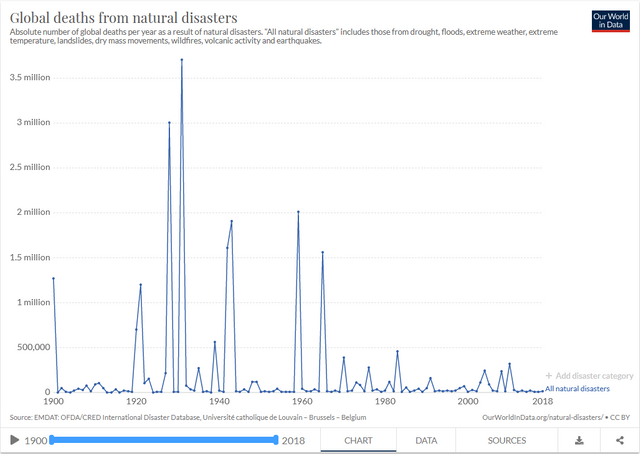
Deaths from natural disasters have decreased the past century while CO2 have increased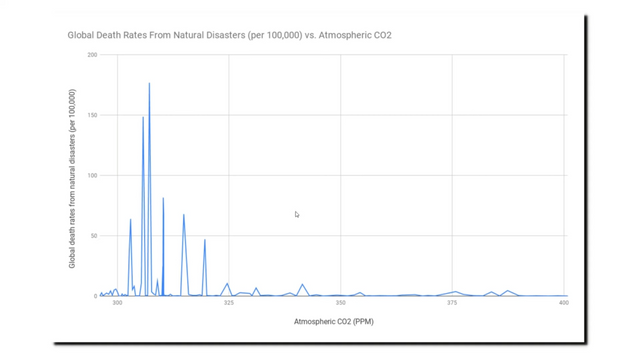
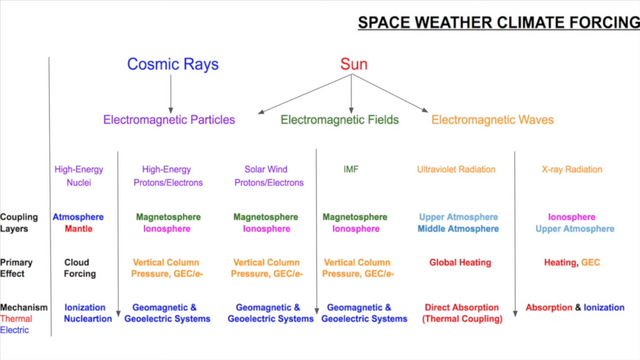
Some of the variables on earth regarding climate change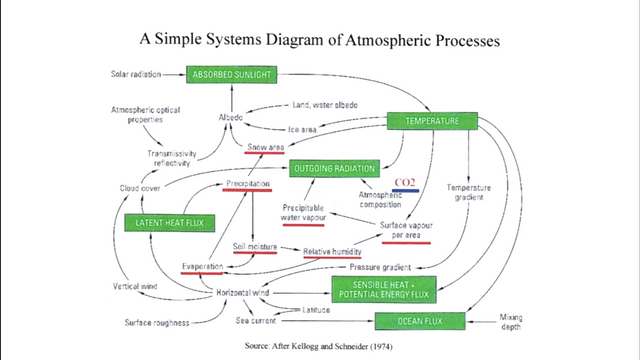
Some of the cycles regarding climate change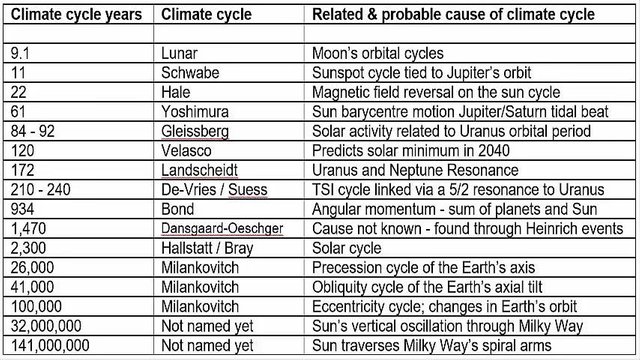
Summary: CO2 and temperature do not correlate meaning that CO2 do not drive temperature and there are a number of variables and cycles to consider which are being ignored. The current climate change hysteria is unfounded, unjustified and based on a scientific and political fraud that is using extremely simplistic terms to describe an extremely complex system.
Click here to find more information about the topic of climate change.
Other places to find me: